
Recent Academic Research
Return seasonality, horizon specific drawdown indicators, earnings versus economic growth, and quantifying diplomatic sentiment flows

Welcome back to another issue of Recent Academic Research! Let’s get into it.
Emerging Market Returns and EPS
National GDP growth has zero correlation with equity returns in emerging markets because corporate earnings growth is the only metric that reaches shareholders.
Investors frequently allocate to emerging markets under the assumption that rapid economic expansion leads to superior stock performance. However, this analysis of 120 years of data across 36 countries proves that GDP growth is an unreliable predictor of returns.
The disconnect occurs because economic growth often benefits labor and consumers, or leads to capital dilution through the issuance of new shares, which prevents existing shareholders from capturing the gains. In contrast, earnings per share growth is the fundamental driver of equity value.
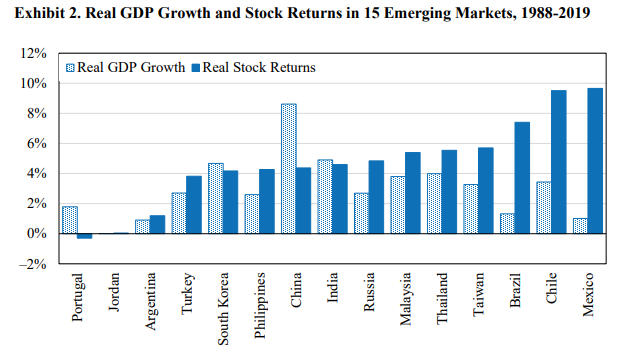
While a country might experience high GDP growth, if that growth does not translate into bottom line profits for listed companies, investors will see poor results.
Chasing high growth economies without considering dilution or profitability is a common mistake that leads to underperformance.
Wool, Phillip and Hsu, Jason C. and Hsu, Jason C. and Ritter, Jay R. and Zhao, Yanxiang, What Matters More for Emerging Markets Investors: Economic Growth or EPS Growth? (May 05, 2022). Available at SSRN: https://ssrn.com/abstract=6523858 or http://dx.doi.org/10.2139/ssrn.6523858
Diplomatic Sentiment and Capital Flows
War related diplomatic rhetoric serves as a quantitative leading indicator for international capital flows and anticipates shifts in risk before traditional indices.
This research uses large language models to analyze diplomatic transcripts and quantify sentiment related to potential conflict. The study finds a direct relationship between aggressive rhetoric and capital flight, particularly in the context of U.S. and China relations.
Specifically, a one unit decline in the Chinese diplomatic sentiment index corresponds to a daily net outflow of approximately 35.6 million dollars. Unlike traditional geopolitical risk indices which often lag behind events, this sentiment measures the verbal temperature of international relations in real time.
It shows that professional capital is highly sensitive to the tone of official statements long before physical conflicts or policy changes occur. Monitoring the nuances of diplomatic language allows for a more proactive approach to managing exposure in sensitive regions.
Yang, Cunyi and Zhang, Shuchi and Kyriakou, Ioannis and Papapostolou, Nikos C., When Words Move Money: Diplomatic Sentiment and International Capital Flows (March 18, 2026). Available at SSRN: https://ssrn.com/abstract=6437669 or http://dx.doi.org/10.2139/ssrn.6437669
Leading Indicators
The predictive power of financial indicators for market drawdowns is highly dependent on the specific forecast horizon being used.
Predicting S&P 500 drawdowns requires a framework that matches specific indicators to the desired timeframe, as no single variable excels across all horizons.
This empirical study tests 30 indicators and finds that short term signals, such as the VIX and the National Financial Conditions Index (which shows an AUC of 0.725 at one month), lose their efficacy as the window expands.
Conversely, variables like M2 money supply growth only become significant predictors at the twelve month mark. The results indicate that the most reliable windows for macro informed risk management are the six and twelve month horizons.
Successful risk management requires rotating indicators based on whether the goal is to manage immediate volatility or long term portfolio drawdowns. Using the wrong tool for the timeframe leads to missed signals and inefficient hedging.
Uyar, Alexander, Leading Indicators of S&P 500 Drawdowns: A Horizon-Specific Macro-Financial Framework (March 20, 2026). Available at SSRN: https://ssrn.com/abstract=6448158 or http://dx.doi.org/10.2139/ssrn.6448158
Return Seasonality
Return seasonality in anomaly portfolios is a mechanical byproduct of individual stock behavior rather than an independent risk premium.
This study examines whether the seasonal patterns observed in factor portfolios, such as momentum or value, represent distinct market risks. By analyzing 125 anomaly portfolios, the researcher demonstrates that these patterns are inherited from the underlying stocks.
Individual stocks possess inherent calendar month cycles, and when these stocks are grouped into portfolios, the resulting seasonality is a simple mathematical projection. The research confirms this by showing that a seasonality factor built from individual stocks fully accounts for the returns of anomaly based strategies (whereas the reverse is not true).
This suggests that seasonality is not a unique premium for which investors are compensated. This finding implies that complex seasonal factor strategies do not offer superior risk adjusted returns compared to simpler stock level approaches.
Wang, Jiaqi, Are Return seasonality Due to Risk or Mispricing? Evidence from Anomaly seasonality (January 26, 2026). Available at SSRN: https://ssrn.com/abstract=6441120 or http://dx.doi.org/10.2139/ssrn.6441120
Feedback
Thank you for reading this week’s edition of Recent Academic Research. Remember to fill out the poll to let me know which paper was your favorite and like the post if you enjoyed it.
Feel free to follow up with any questions, comments, or ideas for the future!
Disclaimer
The content provided in this newsletter, "Alpha in Academia," is for informational and educational purposes only. It should not be construed as financial advice, investment recommendations, or an offer or solicitation to buy or sell any securities or financial instruments. Past performance is not indicative of future results. The financial markets involve risks, and readers should conduct their own research and consult with qualified financial advisors before making any investment decisions.
The interpretations, opinions, and analyses presented herein are those of the author and do not necessarily reflect the views of the original researchers, their institutions, or the full implications of the cited academic papers. While every effort is made to accurately represent the research discussed, readers should be aware that the summaries and interpretations may not capture the full scope or nuances of the original studies. The information contained in this newsletter is believed to be accurate and reliable at the time of publication, but accuracy and completeness cannot be guaranteed. The author and publisher accept no liability for any loss or damage resulting from reliance on the information provided.
This newsletter may contain links to external websites or resources. The author is not responsible for the content, accuracy, or reliability of these external sources.
By subscribing to or reading this newsletter, you acknowledge that you have read and understood this disclaimer and agree to hold the author and publisher harmless from any liability that may arise from your use of the information contained herein.