


Recent Academic Research
The rise of 24-hour trading, analyst variance and skewness expectations, and creating the Phillips Curve from COVID data

Welcome back to another issue of Recent Academic Research! This week, I am highlighting a relevant paper on 24-hour trading with a couple other interesting ones from the past week.
Let’s get into it.
24-Hour Trading
Financial markets are evolving beyond traditional trading hours, with alternative trading systems (ATSs) offering overnight liquidity. This study examines nocturnal trading activity on three ATS platforms (PRO Securities ATS (PROS), Blue Ocean ATS (BOATS), and Interactive Brokers EOS ATS (IBEOS)) from Q1 2018 to Q4 2024. Using FINRA ATS transparency data, the paper investigates the growth, composition, and impact of overnight trading on price formation and market dynamics.
Findings:
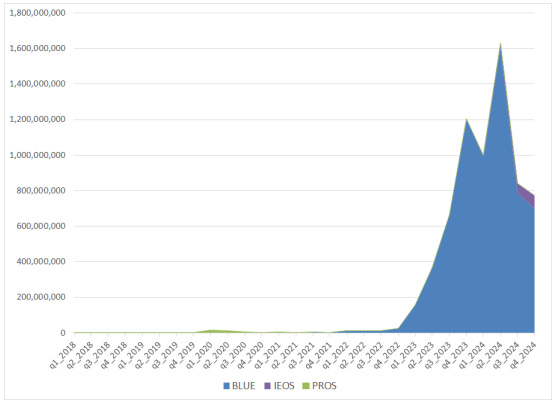
Trading volume on ATSs remained negligible until mid-2021 but surged dramatically afterward, reaching nearly 1.8 billion shares in late 2023 before stabilizing.

The figure reports quarterly share volume by PRO Securities ATS (PROS), Blue Ocean ATS (BOATS), and Interactive Brokers EOS ATS (IBEOS) for the Q1 2018 - Q4 2024 period. These ATSs operate exclusively in the overnight period, 8 p.m. to 4 a.m., starting 8 p.m. on Sunday, ending at 4 a.m. on Friday. The source for the data is the FINRA ATS Transparency data for all NMS securities. Unlike traditional exchanges, ATSs cater primarily to retail investors, with lower institutional involvement due to regulatory constraints and limited order book depth.
Despite lower liquidity, overnight trades influence next-day opening prices, particularly in high-volatility stocks.
Trading activity is heavily skewed toward a small set of liquid stocks, with less activity in mid- and small-cap equities.
Although quoted and effective spreads are wider during the nocturnal period compared to regular market hours, realized spreads are narrower for stocks that trade frequently overnight.
Stocks that trade less frequently overnight have realized spreads that are about the same or only slightly wider during the nocturnal period compared to regular hours.
Eaton, Gregory W. and Shkilko, Andriy and Werner, Ingrid M., Nocturnal Trading (March 16, 2025). Available at SSRN: https://ssrn.com/abstract=5181159 or http://dx.doi.org/10.2139/ssrn.5181159
Variance and Skewness Expectations
Analysts routinely provide stock price targets, but their forecasts also contain implicit expectations about risk. This paper introduces novel firm-level measures of subjective variance and skewness expectations derived from the price forecast ranges in Morgan Stanley equity research reports. Unlike traditional approaches that rely on option-implied measures or past realized moments, these expectations reflect analysts’ forward-looking views under the physical measure.
Findings:
Analyst expectations for variance and skewness positively predict future realized moments, even after accounting for option-implied variance and skewness as well as historical data.
Higher analyst-implied variance correlates with higher future straddle returns, while higher analyst-implied skewness predicts skewness asset returns, generating profitable trading strategies with Sharpe ratios of 0.93 and 1.27, respectively.
A positive risk-return trade-off emerges when using analysts’ expectations, meaning that stocks with higher expected variance also have higher expected returns, in line with traditional finance theory.
A negative skewness-return trade-off is observed, where stocks with higher expected skewness exhibit lower expected returns, reinforcing the idea that investors accept lower returns for assets with lottery-like payoffs.
Bankruptcy, government debt, and commodity markets are major factors influencing variance expectations, while earnings losses, bank loans, and market sentiment play a key role in shaping skewness expectations.
Chen, Shuaiyu and Li, Shuaiqi and Yang, Yucheng, Subjective Expectations for Variance and Skewness: Evidence from Analyst Forecasts (February 27, 2025). Available at SSRN: https://ssrn.com/abstract=5158343 or http://dx.doi.org/10.2139/ssrn.5158343
Relevancy of the Phillips Curve
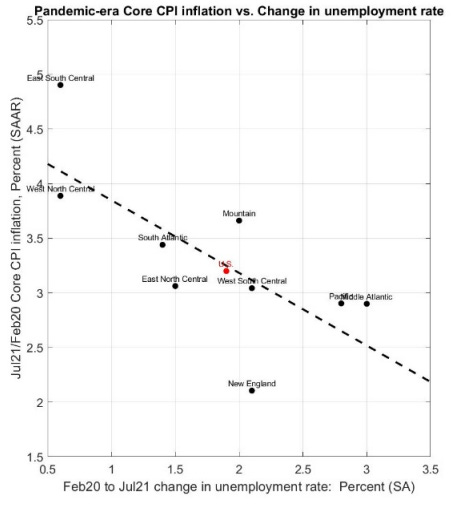
This paper explores how the classic Phillips curve relationship behaved during the COVID-19 pandemic by harnessing regional data to uncover dynamics hidden by national aggregates. The authors review prior literature on the Phillips curve, noting that traditional analyses often rely on broad data that can mask local variations. They introduce a methodology that uses regional information on unemployment and inflation to assess if the expected inverse relationship persisted during the pandemic’s economic disruptions.
Findings:
The inverse relationship between unemployment and inflation weakened significantly during the pandemic, with many regions showing a much flatter Phillips curve than traditionally expected.
Considerable regional heterogeneity emerged, as some areas experienced rising inflation despite persistently high unemployment rates, while others maintained more conventional dynamics.
Supply chain disruptions, labor market rigidity, and targeted fiscal policies appear to have played key roles in altering the usual trade-off between inflation and unemployment.
The use of granular regional data revealed that national-level analyses can obscure important local differences, suggesting that policy impacts varied widely across different areas.
These patterns imply that during unprecedented economic shocks, traditional inflation-unemployment trade-offs may break down due to localized structural and policy-driven factors.
Higgins, Patrick C., The Phillips Curve during the Pandemic: Bringing Regional Data to Bear (September 01, 2021). FRB Atlanta Policy Hub Paper No. 2021-11, Available at SSRN: https://ssrn.com/abstract=5181927 or http://dx.doi.org/10.2139/ssrn.5181927
Feedback
Thank you for reading this week’s edition of Recent Academic Research. Remember to fill out the poll to let me know which paper was your favorite and like the post if you enjoyed it.
Feel free to follow up with any questions, comments, or ideas for the future!
Disclaimer
The content provided in this newsletter, "Alpha in Academia," is for informational and educational purposes only. It should not be construed as financial advice, investment recommendations, or an offer or solicitation to buy or sell any securities or financial instruments. Past performance is not indicative of future results. The financial markets involve risks, and readers should conduct their own research and consult with qualified financial advisors before making any investment decisions.
The interpretations, opinions, and analyses presented herein are those of the author and do not necessarily reflect the views of the original researchers, their institutions, or the full implications of the cited academic papers. While every effort is made to accurately represent the research discussed, readers should be aware that the summaries and interpretations may not capture the full scope or nuances of the original studies. The information contained in this newsletter is believed to be accurate and reliable at the time of publication, but accuracy and completeness cannot be guaranteed. The author and publisher accept no liability for any loss or damage resulting from reliance on the information provided.
This newsletter may contain links to external websites or resources. The author is not responsible for the content, accuracy, or reliability of these external sources.
By subscribing to or reading this newsletter, you acknowledge that you have read and understood this disclaimer and agree to hold the author and publisher harmless from any liability that may arise from your use of the information contained herein.